Our framework is based on an extensive analysis of the characteristics of historical cyber risk events including triggers, propagation and impact. The framework uses Kovrr’s proprietary event catalog with more than 100,000 synthetic events for loss simulation which vary from cloud provider outage in a specific territory to massively distributed global ransomware attacks and other tail events.
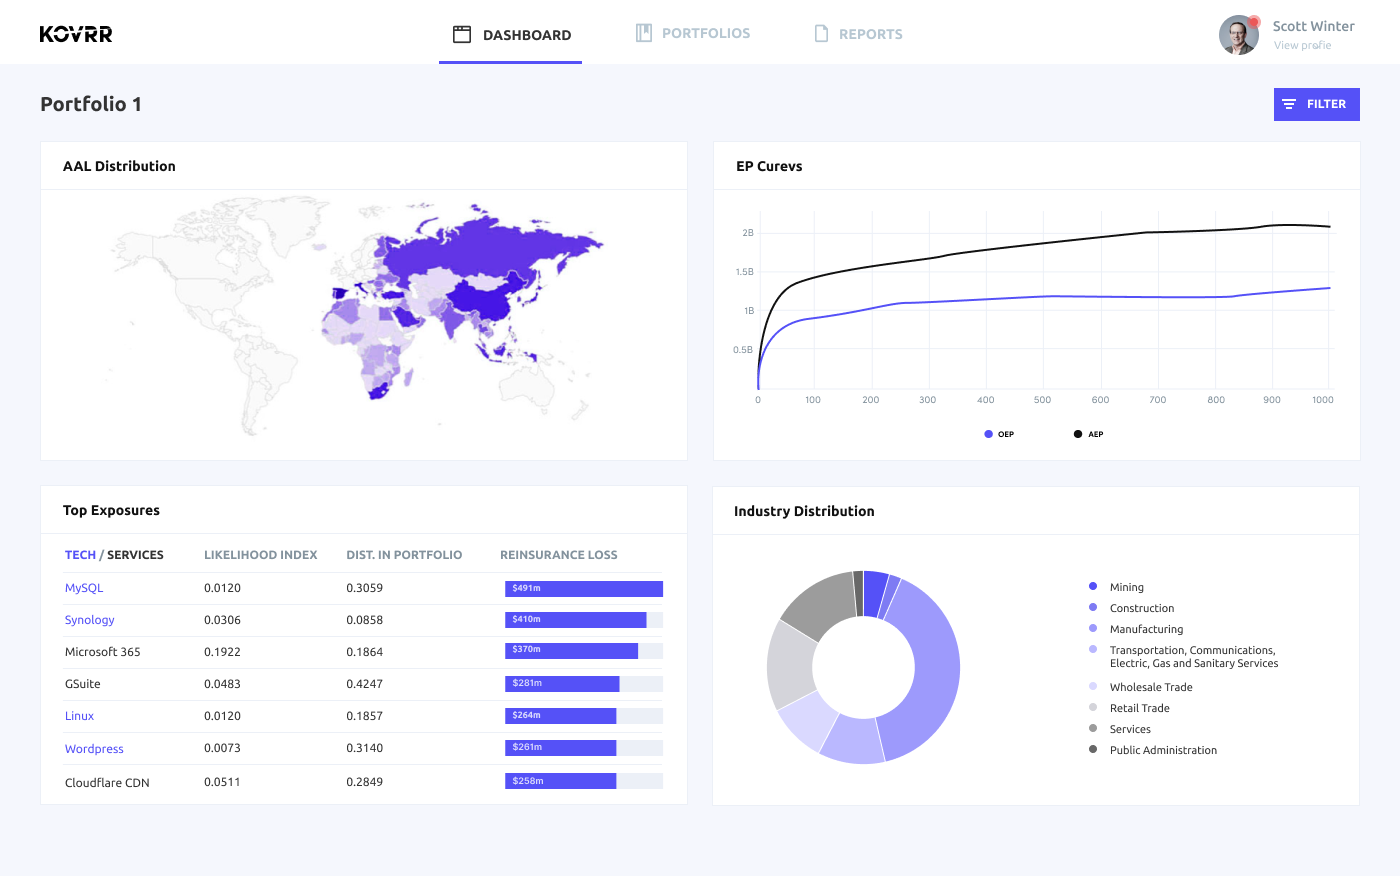
Detailed event catalog provides a full view of risk, allowing view of loss by category - catastrophic loss events, large loss events, and attritional loss events.
Achieve clear visibility to probable maximum losses due to potential large loss and catastrophic cyber events. Leverage Kovrr’s impact based modeling framework to assess known knowns and known unknowns by applying probabilistic and deterministic cyber risk scenarios, including Lloyds RDS.
The Kovrr platform reflects emerging exposures and allows (re)insurers to control risk accumulation by notifying them when pre-defined risk thresholds are crossed.
Gain visibility to risk associated with potential cyber triggered claims within any commercial P&C insurance book.
Calculate aggregated exposure to cyber risk in your portfolio while taking into account systemic risk stemming from different types of policies within various lines of businesses.
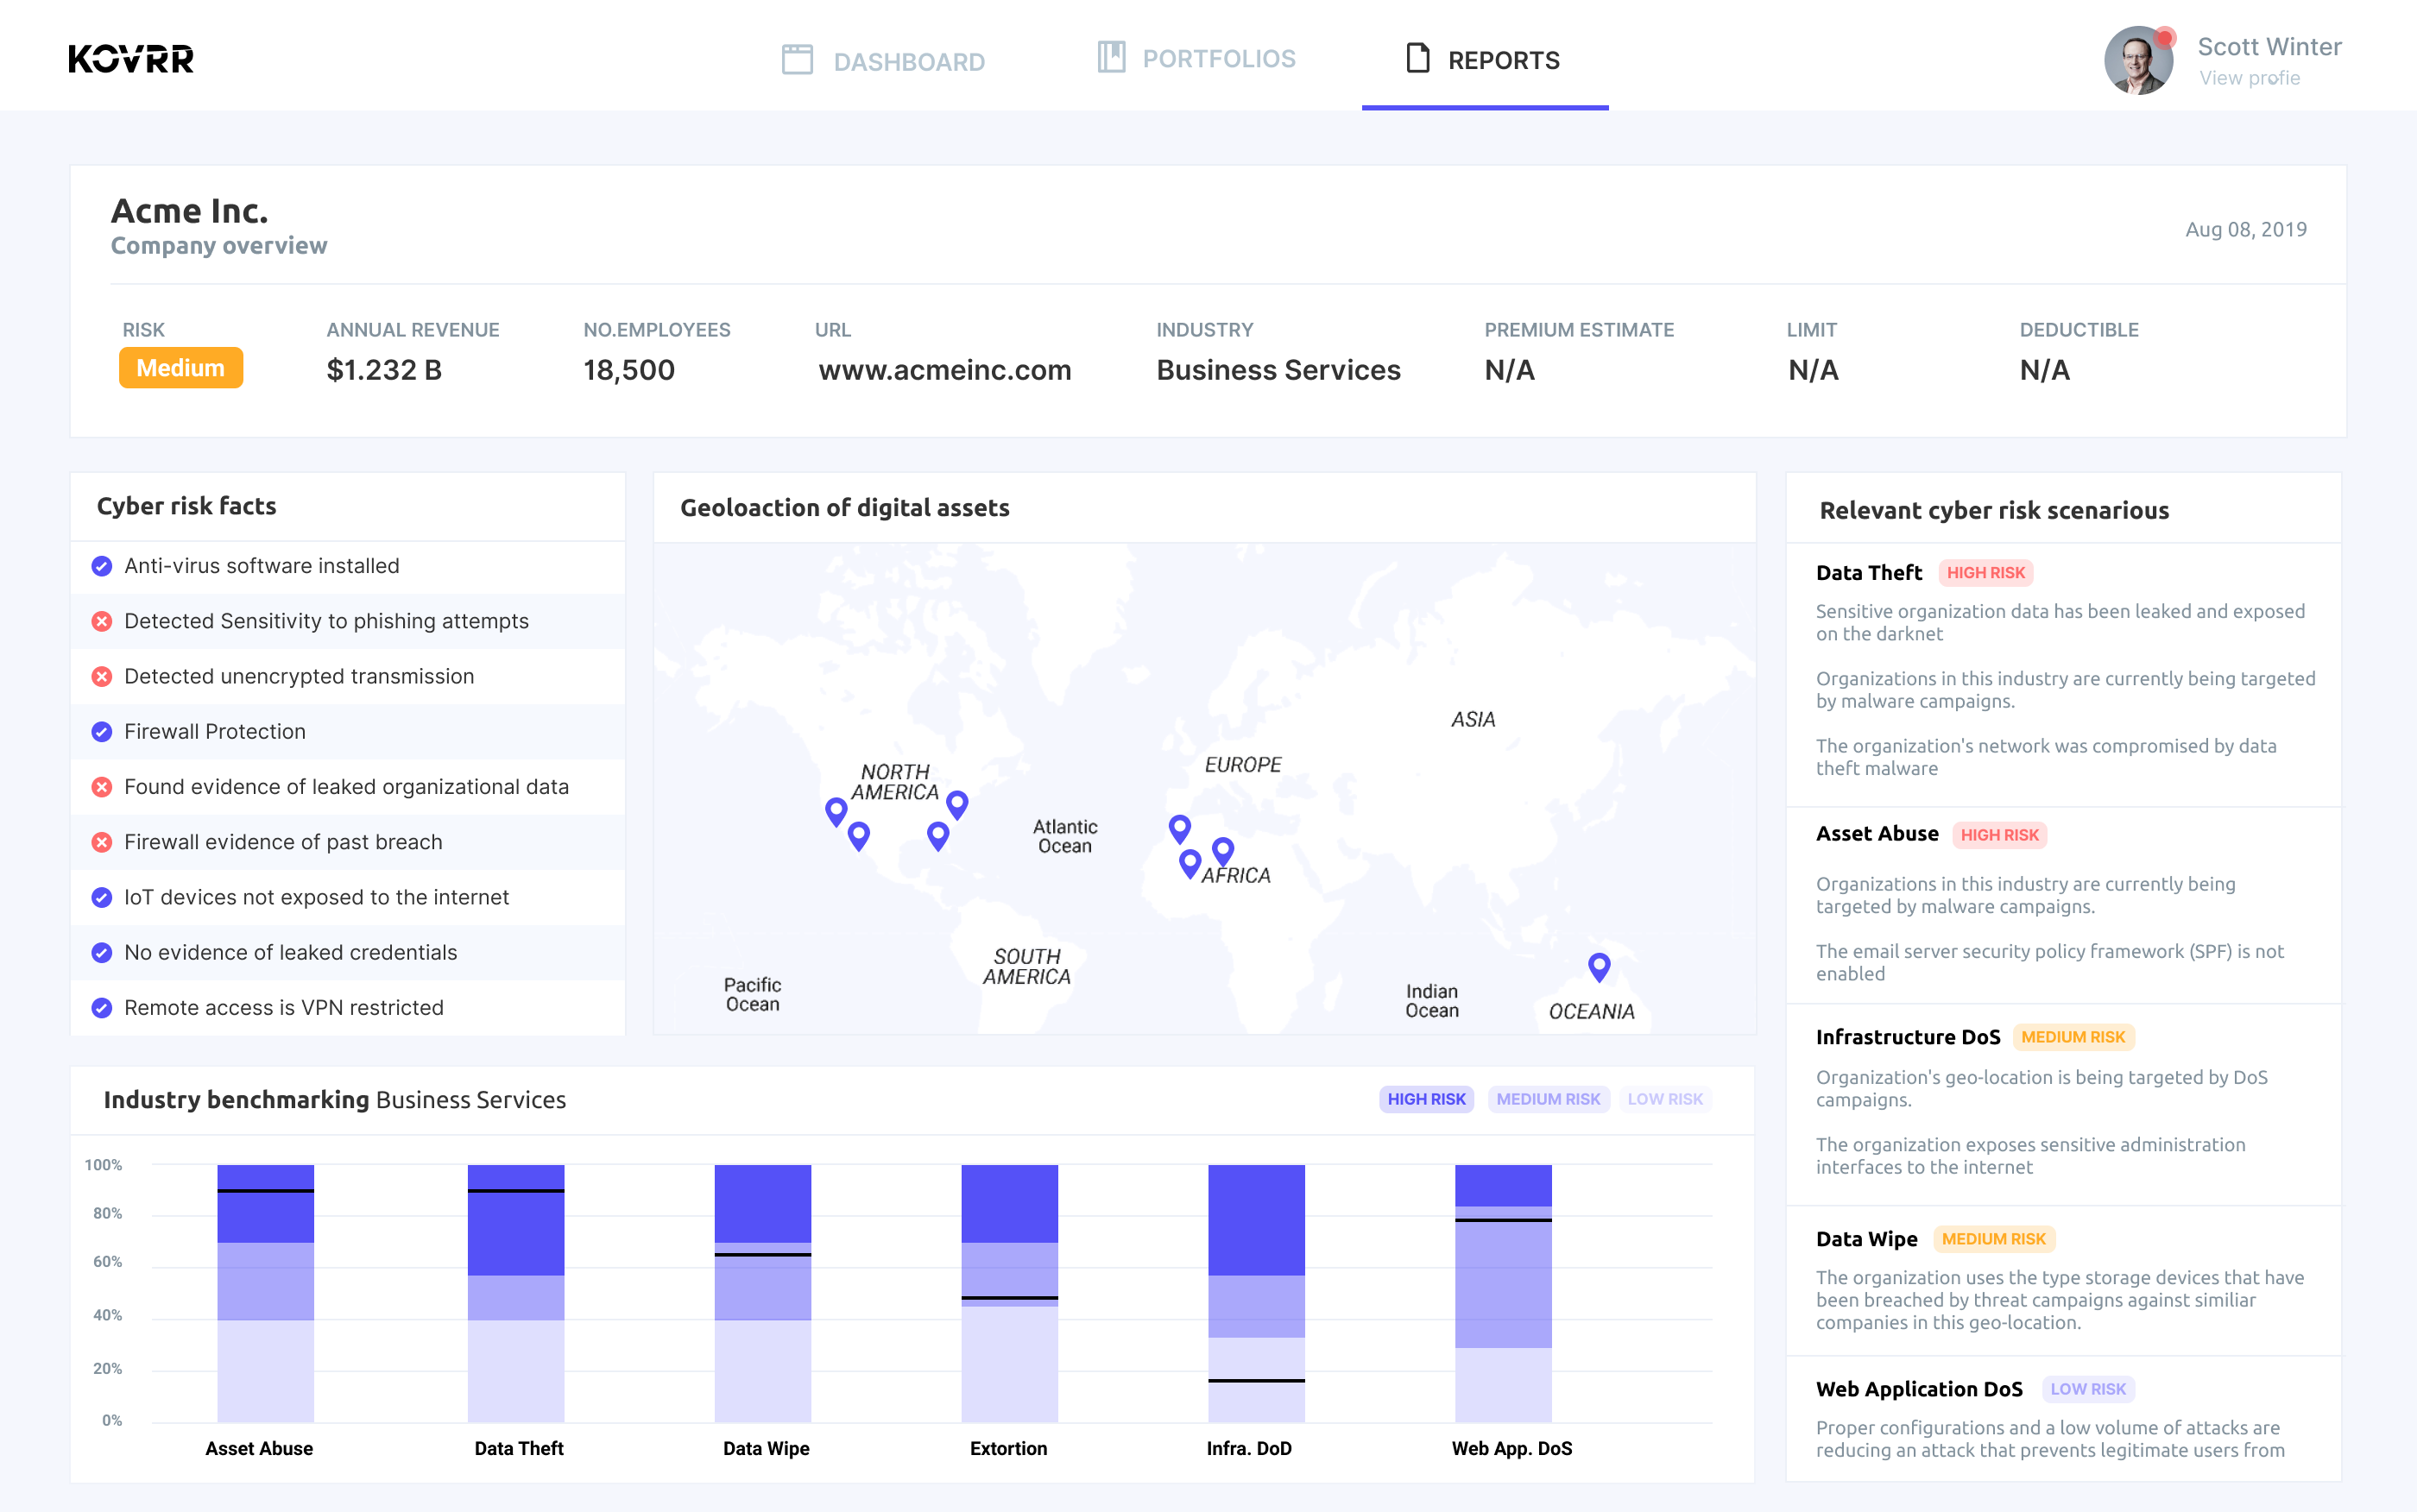
(Re)insurers can assess their cyber exposure in any type of (re)insurance’s book using a list of predefined scenarios, both historical and synthetic. They can also custom build their own scenarios. For example, a reinsurer can quantify the exposure of its commercial property book to a large scale business interruption event such as the NotPetya ransomware attack.


Asses potential economic impact, insured annual average loss (AAL), and probable maximum loss (PML) broken down by coverage.
Understand the projected insured attritional and large loss of specific risk scenarios such as data theft, denial of service, ransomware, extortion, etc. Kovrr helps insurers segment customers and diversify their book via analysis of a company's use of commercial software, geography, third party services and susceptibility to a cyber attack.
Pinpoint potential clients for cyber insurance within your existing P&C portfolios.
Shorten or eliminate the questionnaire process by augmenting missing information, validating provided data and cutting out questions from the insurance application. Power digital rate-quote-bind portals.
Download the framework in order to measure & understand your catastrophic cyber risk exposure.

Cyber Risk Impact Zones (formerly known as CRA-Zones) were established to provide an easy to use open framework to measure and understand catastrophic cyber risk exposure. The Crimzon framework defines the minimal elements needed to provide a view of aggregated cyber exposure. CRIMZON allow for analysis across multiple portfolios of risks and monitoring of exposure trends. The framework was also created to support regulatory efforts for setting a standard for data collection for cyber exposure management.
For natural catastrophe risk, individual policy exposures can be aggregated within geographic zones. Similarly, cyber exposures can be aggregated using Crimzon. Geographic location is still important when assessing cyber catastrophe risk, however, two additional elements must be taken into account to properly assess cyber risk aggregation - industry sector and company size. The foundation of the Crimzon is built on acquired historical data and continuous analysis of millions of cyber incidents worldwide.
Analysis has shown a significant correlation between companies from the same location and industry tending to use the same third-party service providers and technologies, leaving them exposed to corresponding cyber attacks. Additionally, the analysis demonstrated that entity size has a direct correlation to technologies used, cyber preparedness, security policies, cybersecurity spending, and level of sophistication of cyber attacks.
Country level worldwide and state granularity in the US -based on the ISO-3166 Alpha-2 standard.
Industry classification breakdown based on the SIC classification system with additional granularity options.
Four categories based on commonly used revenue bands.
The framework is built to accommodate users with various levels of data. In cases with insufficient data, an automated data extrapolation technique can be applied for cyber exposure analysis using Crimzon.
Zones can be viewed with low or high granularity. The views are built to accommodate the ability to use the platform despite varying quality of data within a group of risks

Open framework - No need to license a model
Understand your cyber risk accumulation
Facilitate portfolio risk diversification
Easily track portfolio aggregation trends
Gain a view of risk that reflects risk accumulation across multiple portfolios
Detect correlation between risk accumulation & cyber attacks trends
Monitor compliance with defined risk appetite
Support regulatory reporting obligations
Financially quantify probable maximum loss (PML) events
Benchmark to average losses and average industry exposure per zone


Kovrr financially quantifies cyber risk on demand. Our technology enables decision makers to seamlessly drive actionable cyber risk management decisions.